F1 Points Calculator
F1 Points Calculator lets you predict the results of Formula 1 races and see how they change the championship. You drag drivers into finishing positions for each race of the 2026 season, including sprints, and the drivers’ and constructors’ standings update straight away. You can also open past seasons back to 1958, switch to an older points system, and enter a prediction league.
Free to use, no account needed for the calculator.
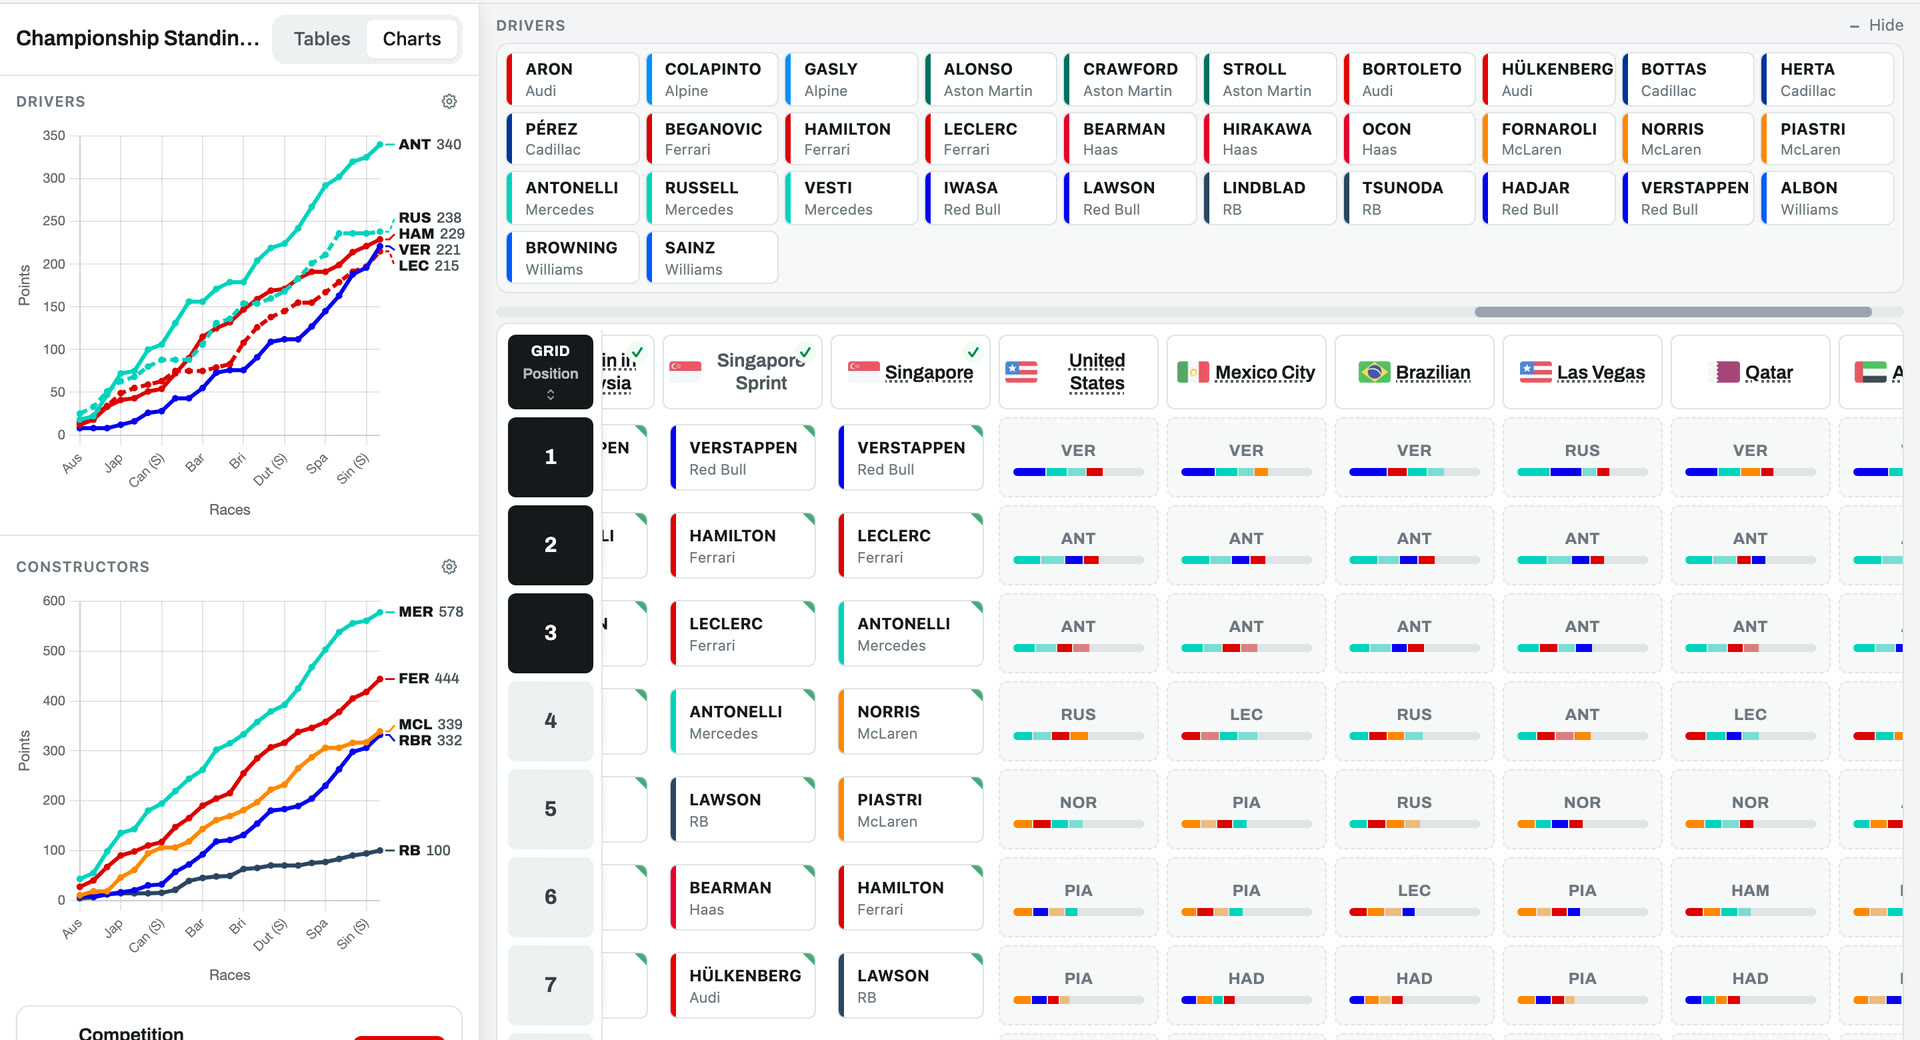
Predict race results
The main page is a grid with one column for each race and one row for each finishing position. The drivers for the season are listed above the grid. To predict a result, drag a driver onto a position. Sprint races have their own column and use sprint points: 8-7-6-5-4-3-2-1 for the top eight.
Races that have already taken place show the official results. The Results button shows or hides them. You can right-click a driver in the grid to copy, paste or swap them, and Reset clears all of your predictions.
Standings and charts
The drivers’ and constructors’ standings are on the left and update after every change. The points each driver gained in the race you edited are shown next to their total.
A line in the drivers’ table separates the drivers who can still win the championship from those who can’t, and shows how many points are left in the season. The Charts tab shows each driver’s and each team’s points total after every race.
Consensus shows which drivers other users have predicted for each position in the upcoming races.
Change the points system
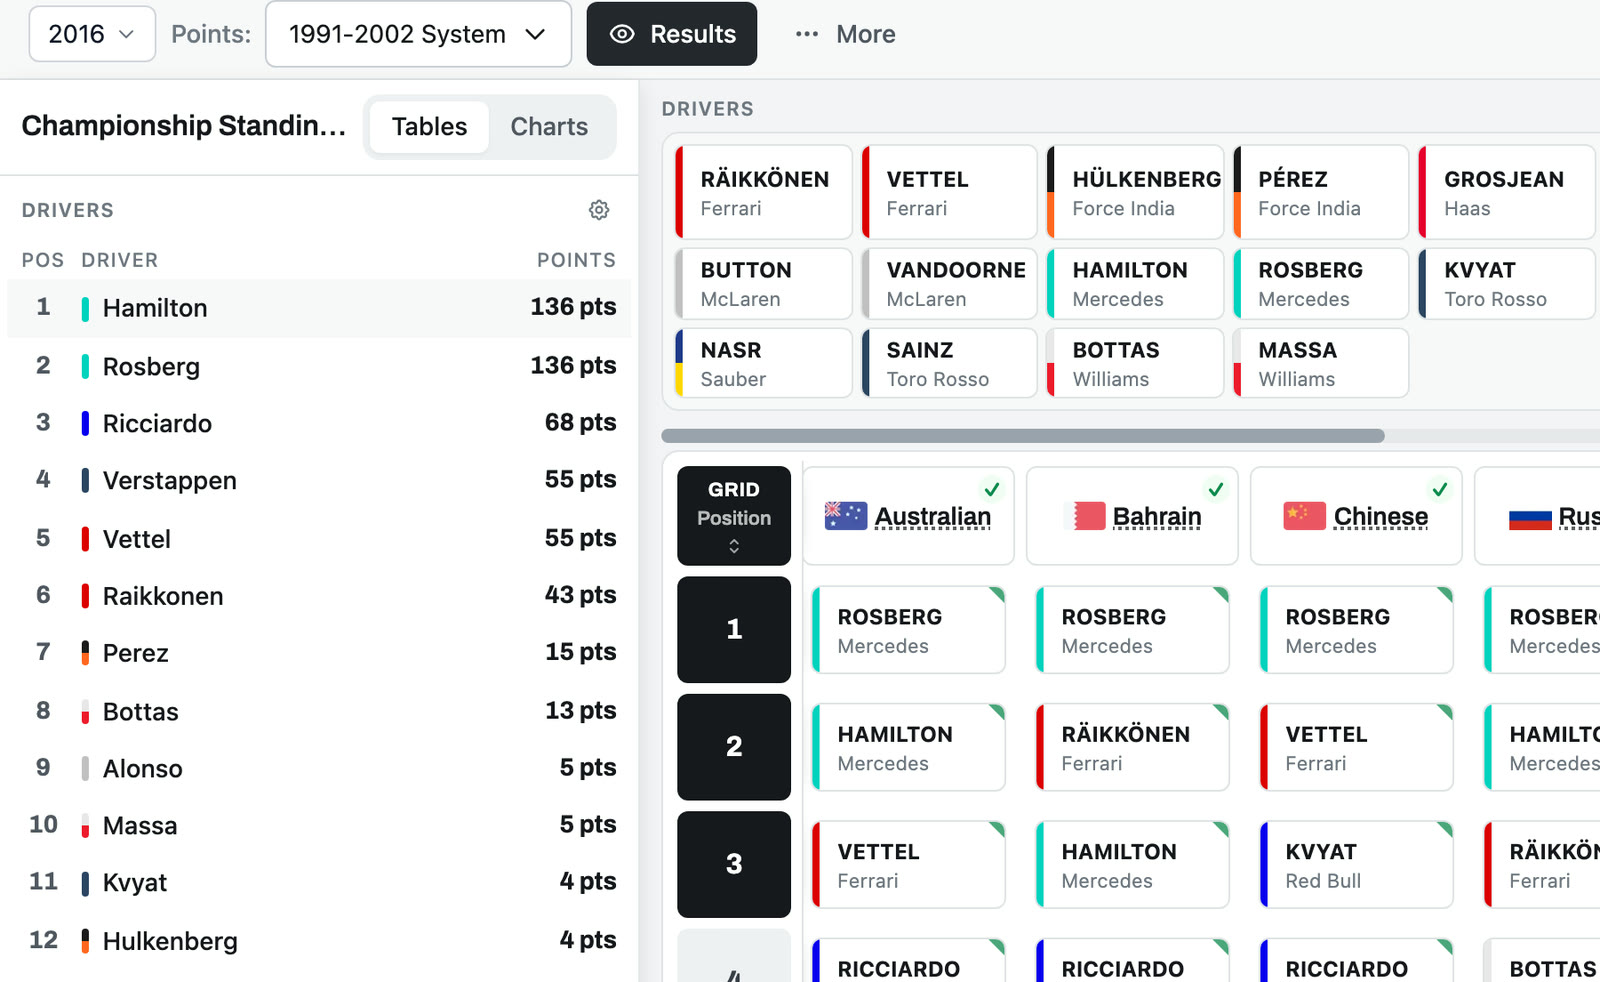
The Points menu lists the points systems F1 has used, including the 1960 system (8-6-4-3-2-1), the 1991–2002 system (10-6-4-3-2-1), the 2003–2009 system (10-8-6-5-4-3-2-1) and the current system (25-18-15-12-10-8-6-4-2-1). It also has systems from other racing series and some alternatives, such as a linear system that awards 20 points for a win and one point less for each place down to 20th. Each system has a short description of when it was used.
When you change the system, every race in the season is rescored. For example:
- 2016 with the 1991–2002 system: Hamilton and Rosberg both finish on 136 points, with Hamilton listed first. Rosberg won the real championship by five points.
- 2012 with the 2003–2009 system: Vettel finishes one point ahead of Alonso instead of three.
- 2021 with the 2003–2009 system: Verstappen still wins, and Leclerc finishes fifth instead of seventh.
Past seasons
You can open any season from 1958 to 2026. Seasons from 2012 onward are free. Seasons before 2012 are part of an archive that you unlock with a one-time payment.
Seasons include notes on unusual scoring. For example, the 2021 notes explain that the Belgian GP awarded half points because the race was stopped after two laps behind the safety car.
Save and share predictions
Predictions are saved automatically, and Version History lists your past edits. If you sign in with Google or with an email and password, your predictions are synced across your devices.
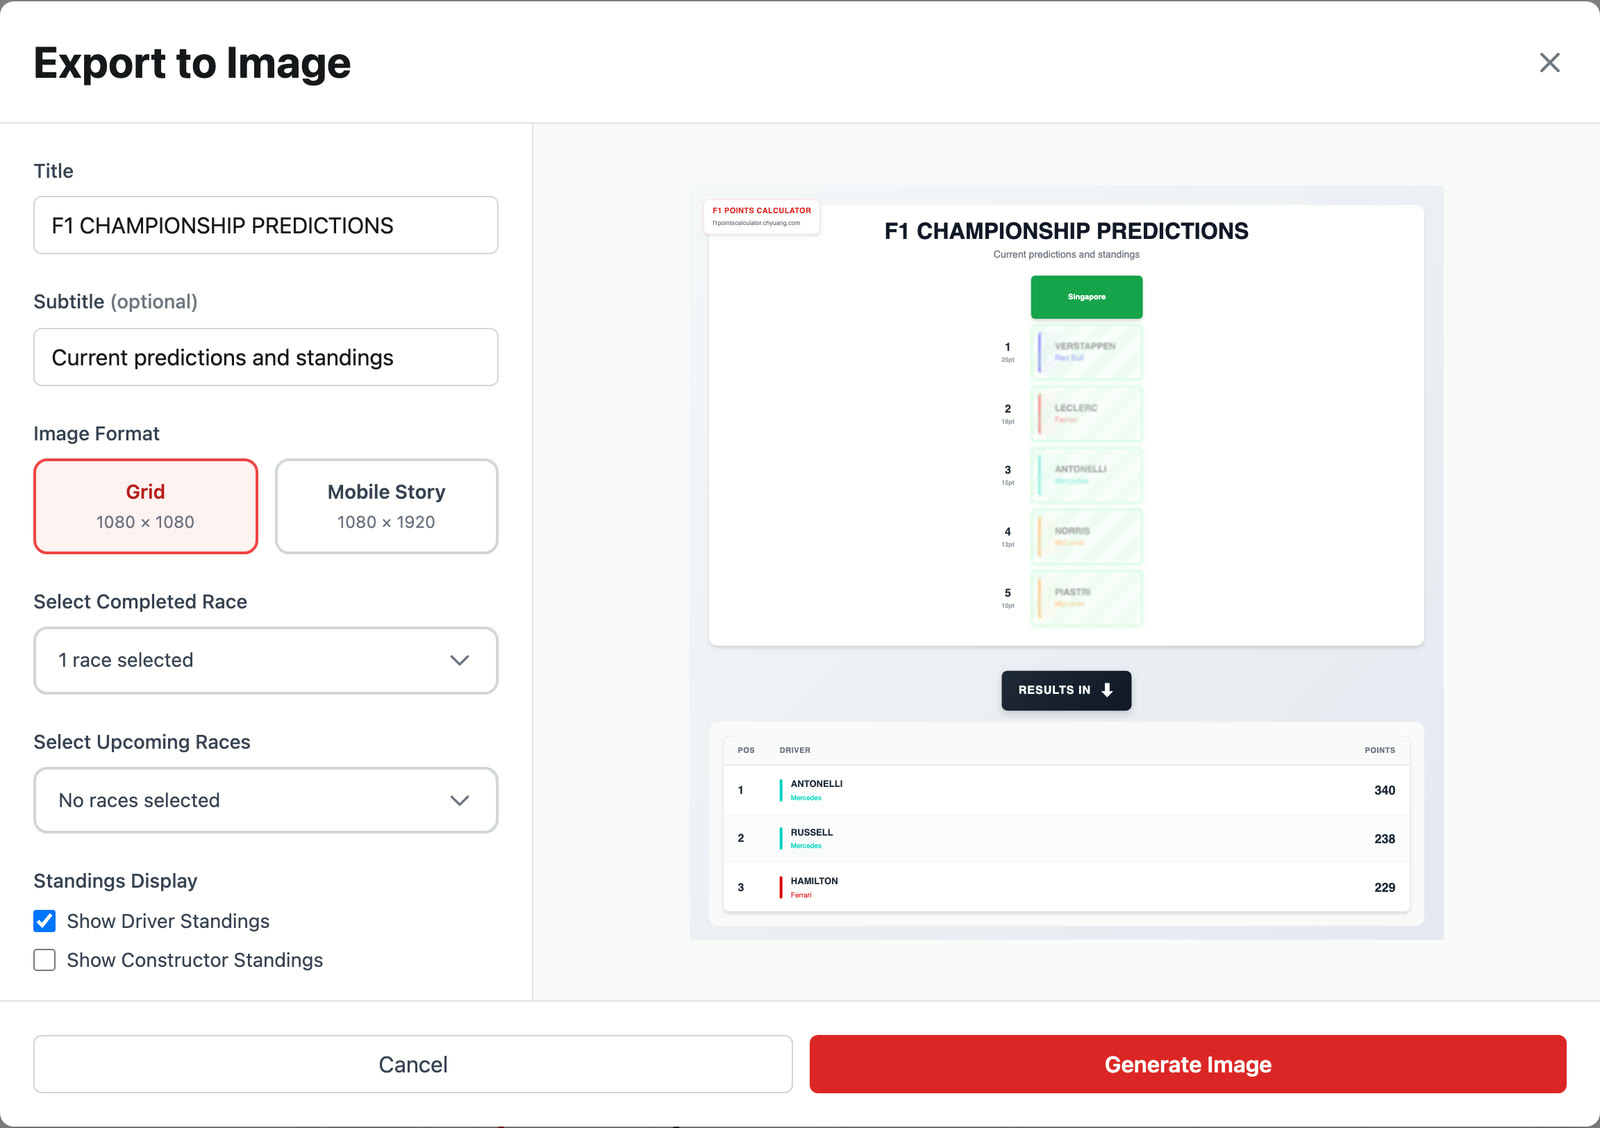
Export Image creates a picture of your predictions in square (1080 × 1080) or story (1080 × 1920) format. You can set the title, choose which races to include, and choose whether to show the drivers’ standings, the constructors’ standings, or both.
Prediction league
In Compete, you lock in a prediction before each race starts. After the race, you get one point for every driver you placed in the correct position, and the season leaderboard ranks players by accuracy. The 2026 leaderboard has 147 players.
Driver and circuit pages
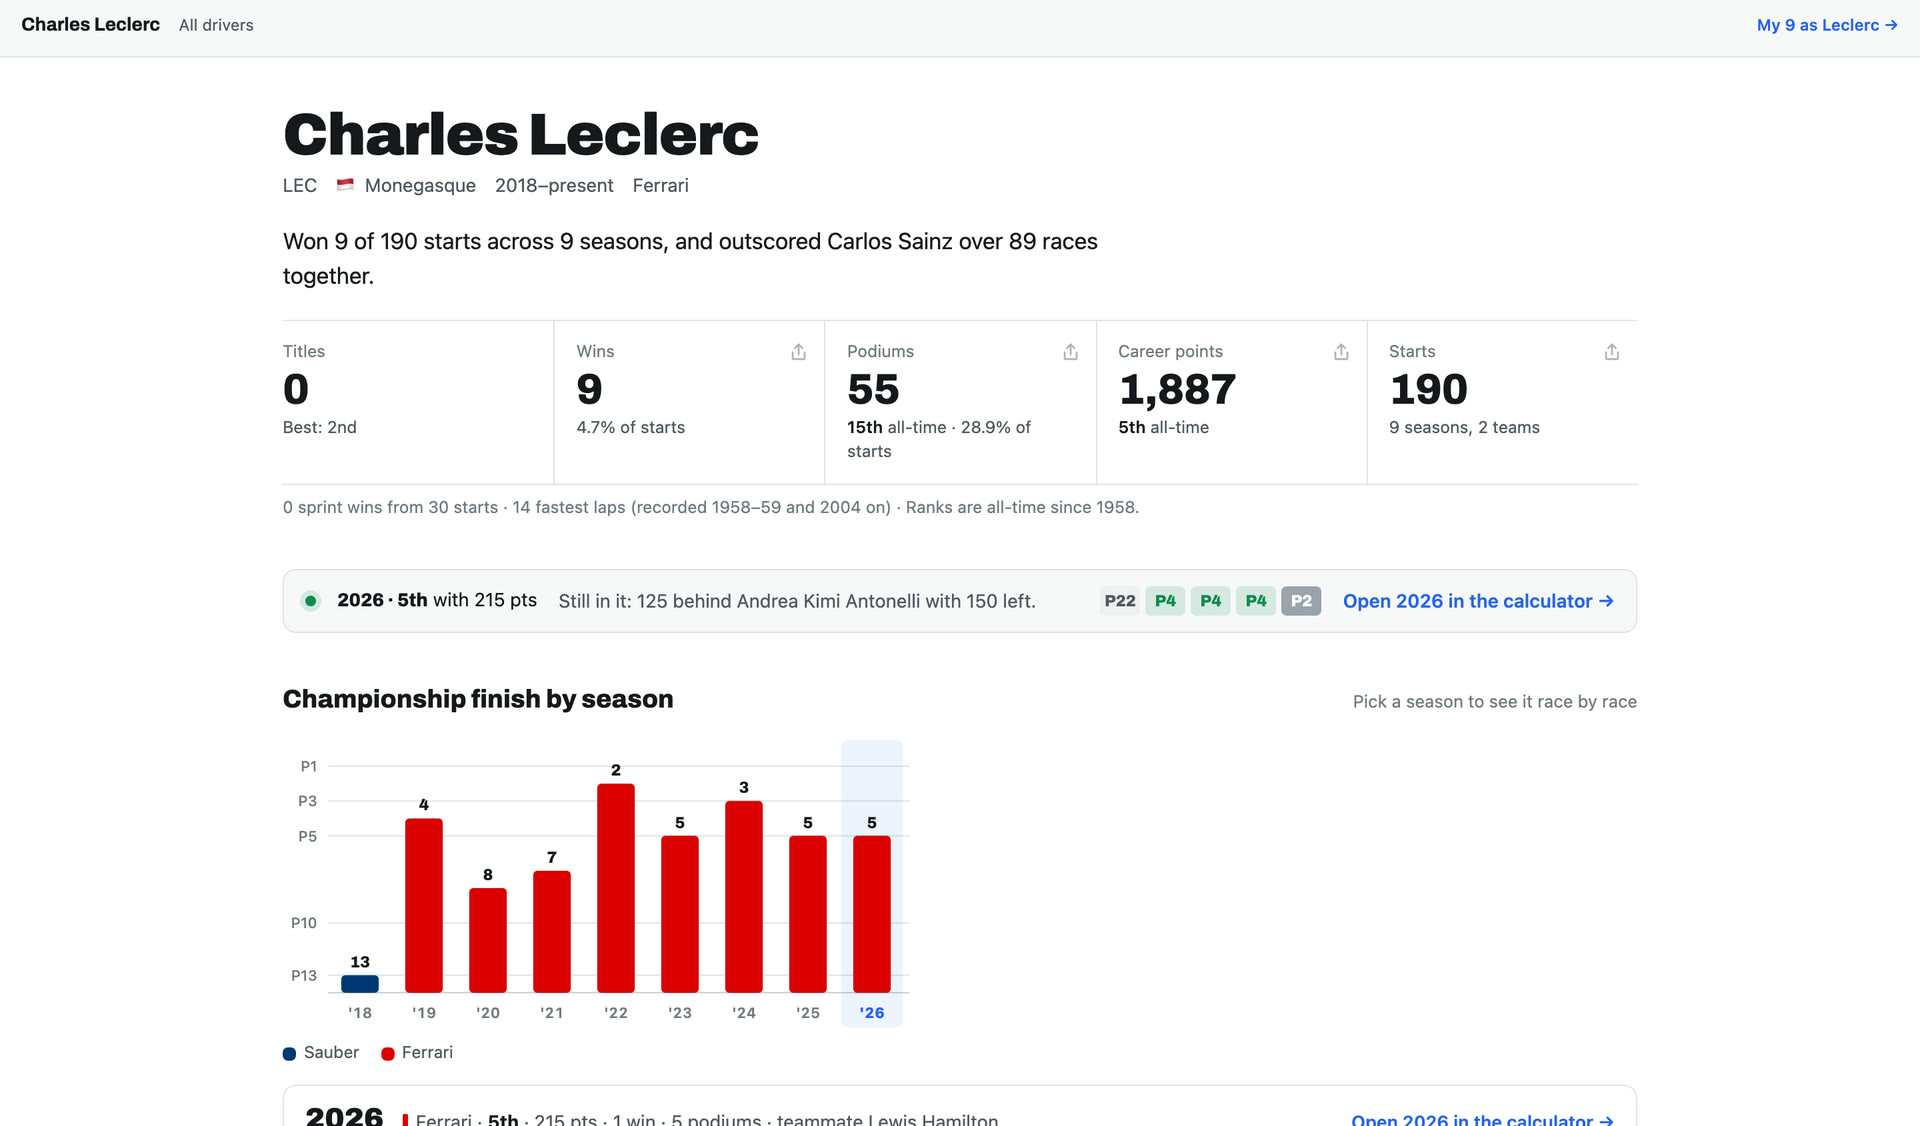
Each driver has a page with their career totals and all-time rankings, their results against each teammate, and their championship position in every season. For current drivers, the page also shows whether they can still win this year’s title, with a link to the calculator.
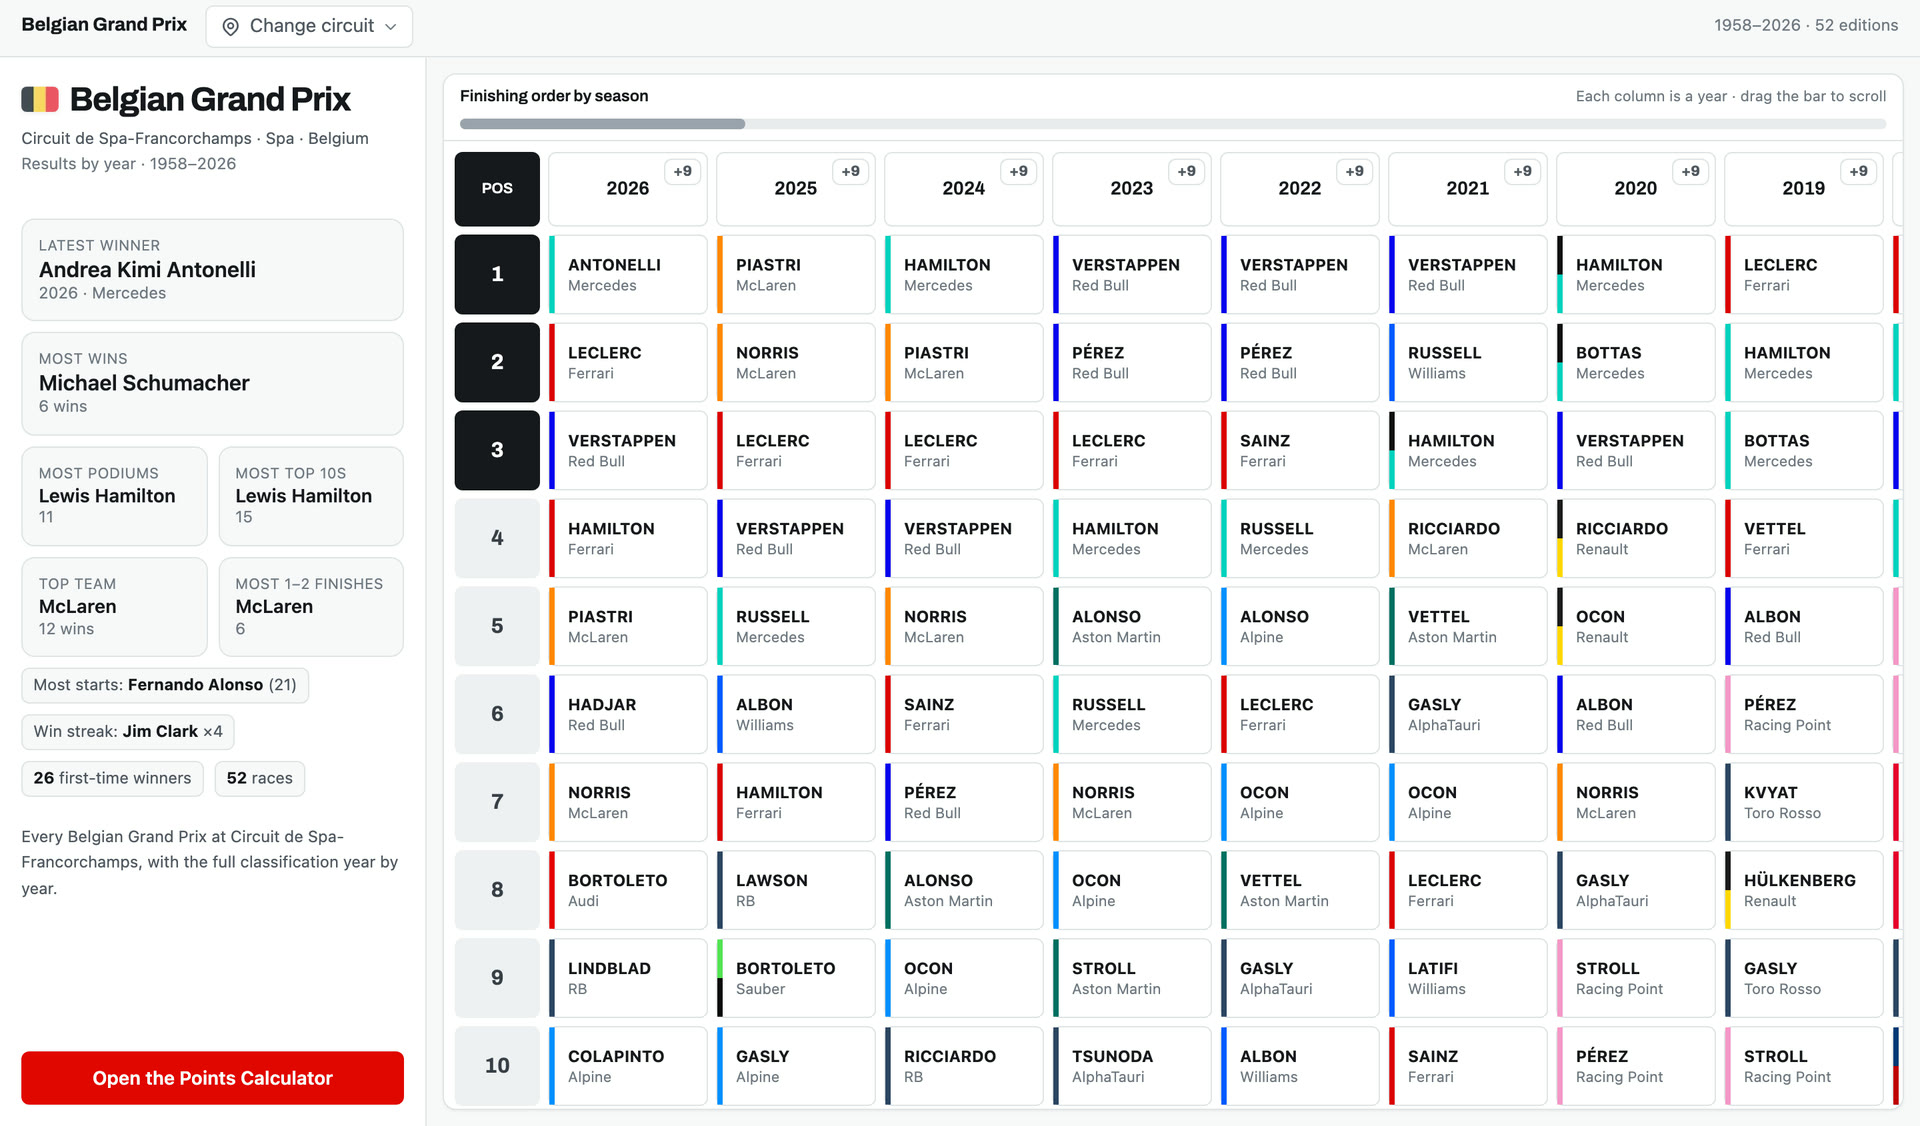
Each circuit has a page with the finishing order of every race held there, year by year, and records such as most wins and most podiums. The Belgian Grand Prix page covers 52 races at Spa since 1958.
My 9
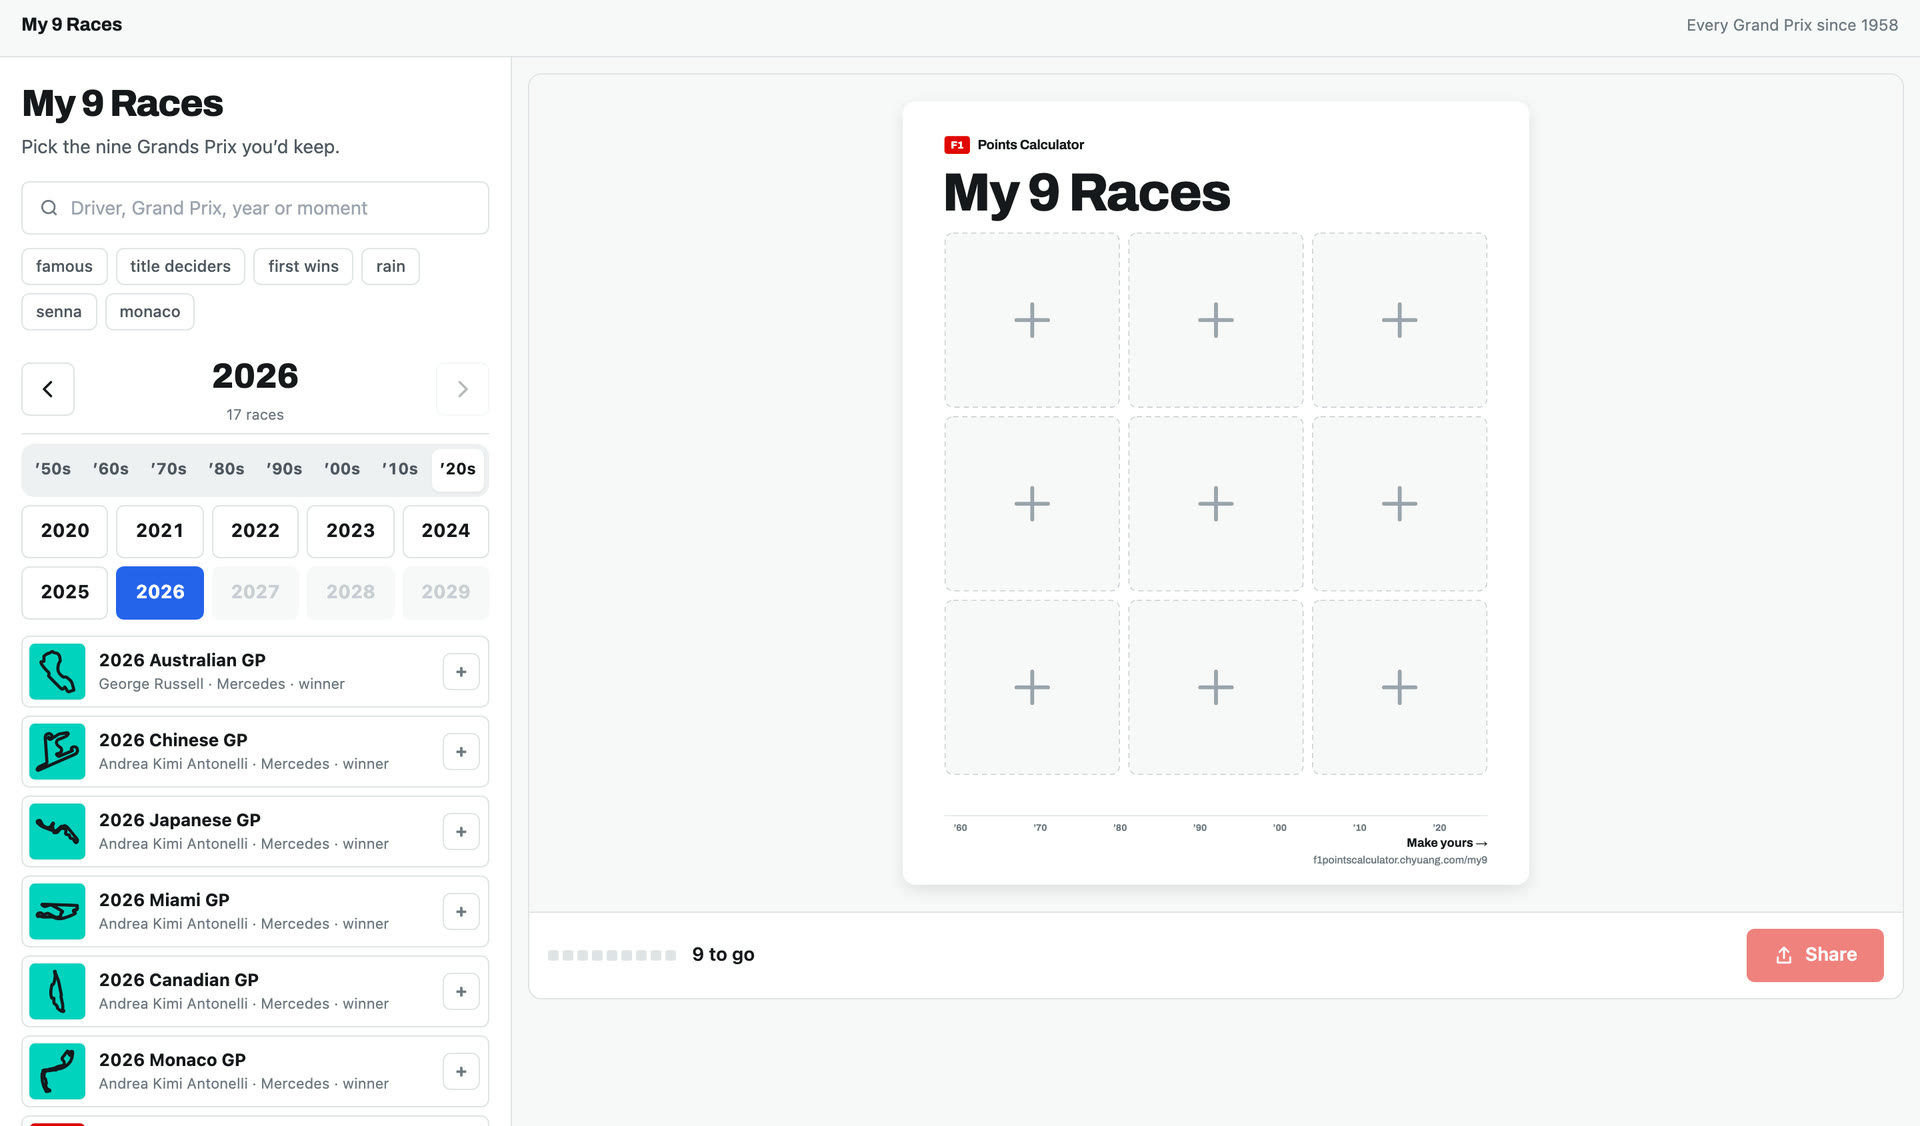
My 9 lets you choose nine Grands Prix from any season since 1958 and share them as a 3 × 3 image. You can search by driver, race, year or event, or browse lists such as title deciders, first wins, wet races, Senna and Monaco.
Race preview blog
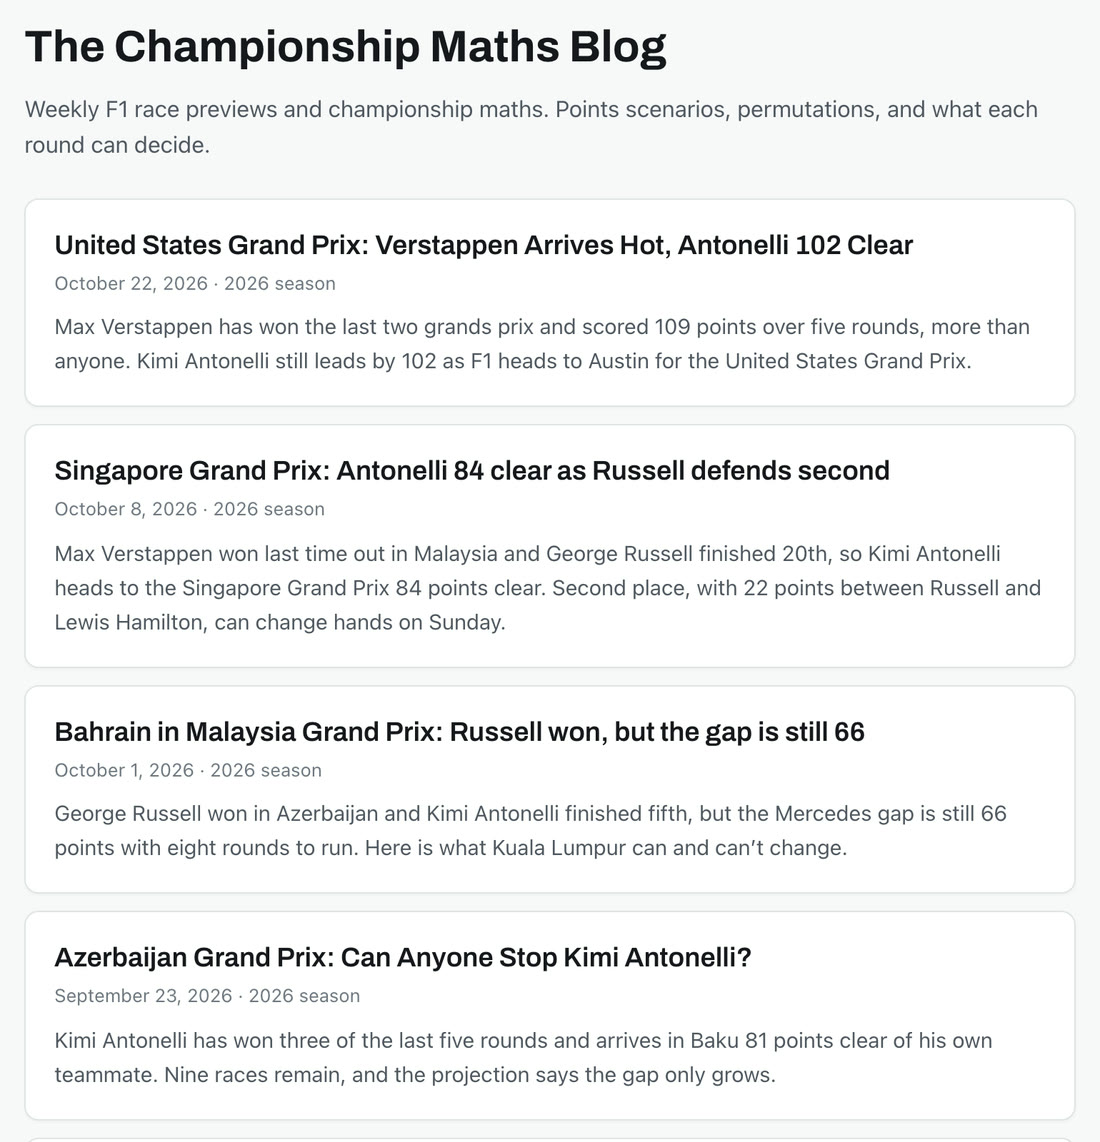
The blog publishes a preview before each race. Each preview covers the current points gaps, which drivers can still win the title, and which results would change the standings.
On a phone
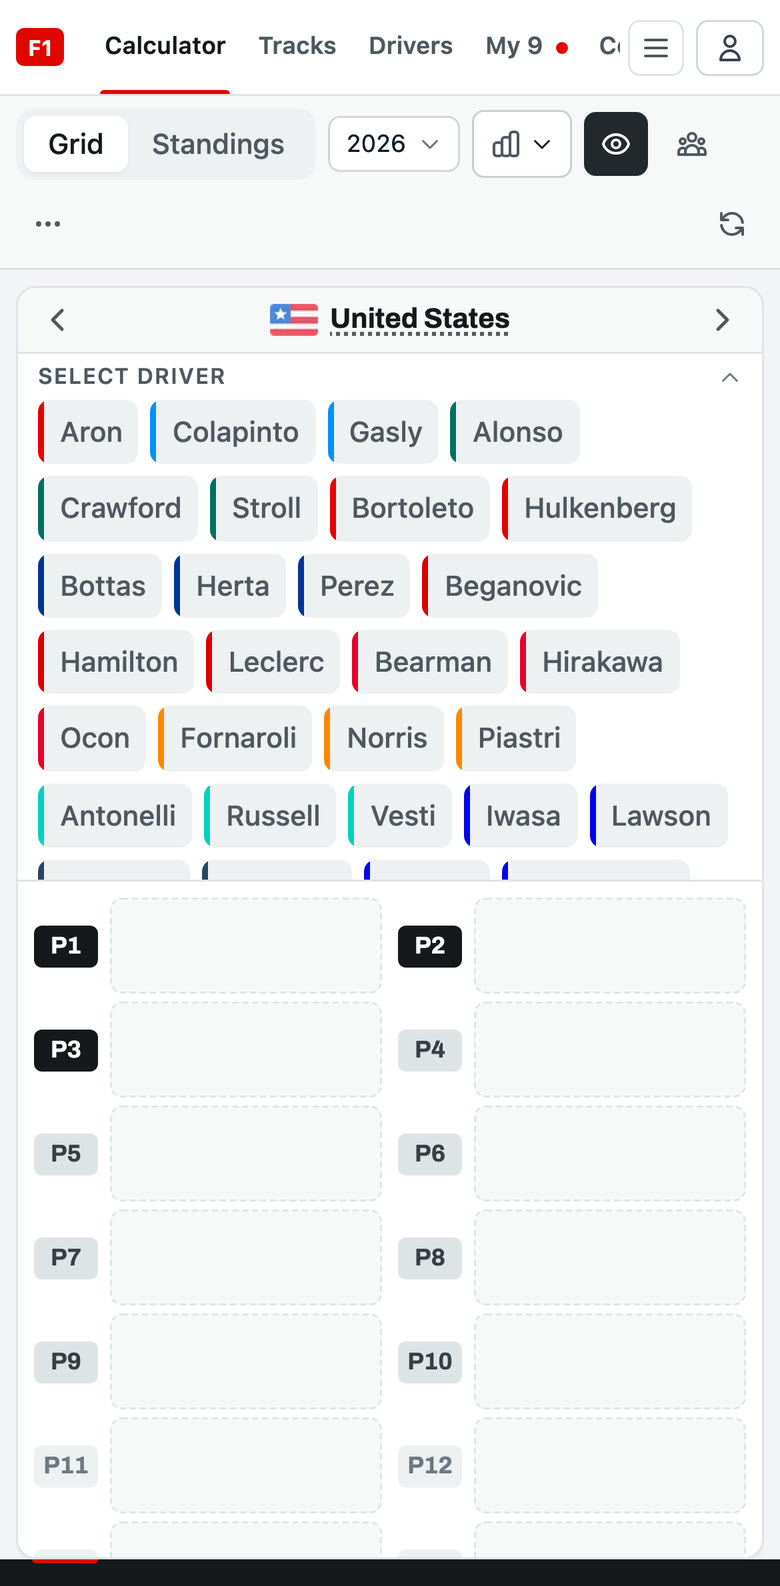
On a phone, the calculator shows one race at a time. The drivers are listed at the top and the positions are below them. The arrows move to the next or previous race, and the Grid and Standings tabs switch between predicting and viewing the table. The rest of the site is in the bar at the bottom of the screen.
More racing
All racing →