Japanese Patent Attorney Rankings
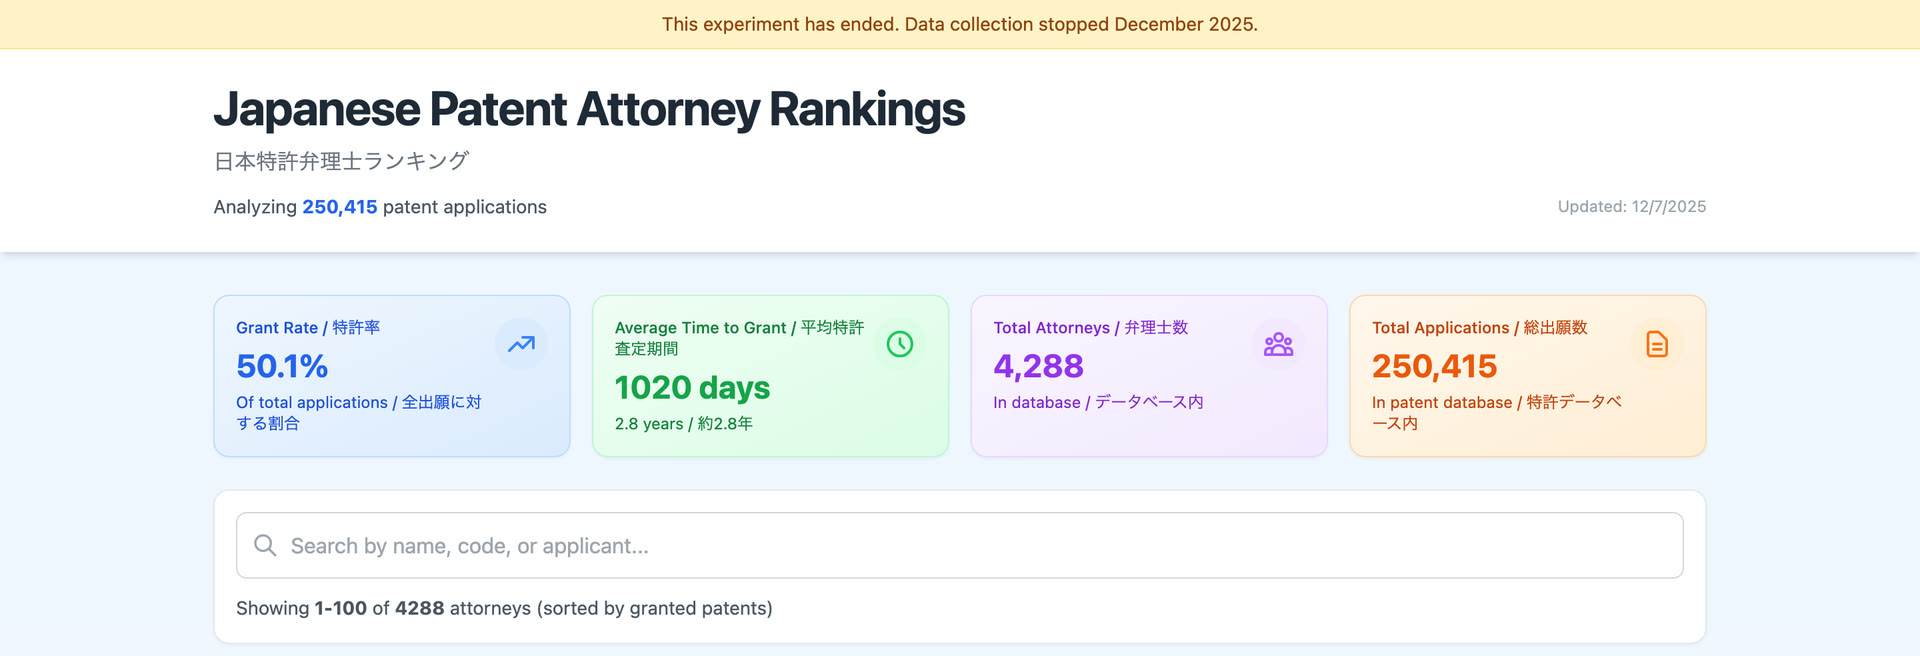
Japanese Patent Attorney Rankings is a bilingual English and Japanese site that lists 4,288 patent attorneys and other representatives with the number of their applications that reached registration. The data covers the 101,880 Japanese unexamined patent publications published from 7 January to 6 May 2010, with each application’s status taken from the JPO’s patent information API. Collection stopped in December 2025 and the site is no longer updated.
Free. No longer updated: the data covers publications from January to May 2010.
What the data covers
The collector went through Japanese unexamined patent publications in number order, starting at JP 2010-000001. For each one it read the application number from Google Patents, then requested the application’s progress record from the JPO’s patent information API. From that record it took the representatives (代理人), the applicants and the outcome.
The collector was limited to 399 API requests a day. It ran daily between March and December 2025 and stopped after publication JP 2010-101879, so it covers publications from 7 January to 6 May 2010. It was set up to continue through 2023, but no later publications were collected. Of the 101,880 publications, 92,355 name at least one representative.
The list is keyed on the JPO’s representative codes, so it also includes some lawyers, law firms and companies that acted as representatives, not only registered patent attorneys (弁理士).
How the figures are calculated
An application counts as granted if the JPO record has a registration date or a decision to grant (特許査定). Every other application counts as not granted. That group includes applications that received a decision of refusal, applications that were withdrawn or abandoned, and applications for which examination was never requested, because the data does not separate them.
- Rate is the number of granted applications divided by all of the representative’s applications, so applications that were never examined lower it.
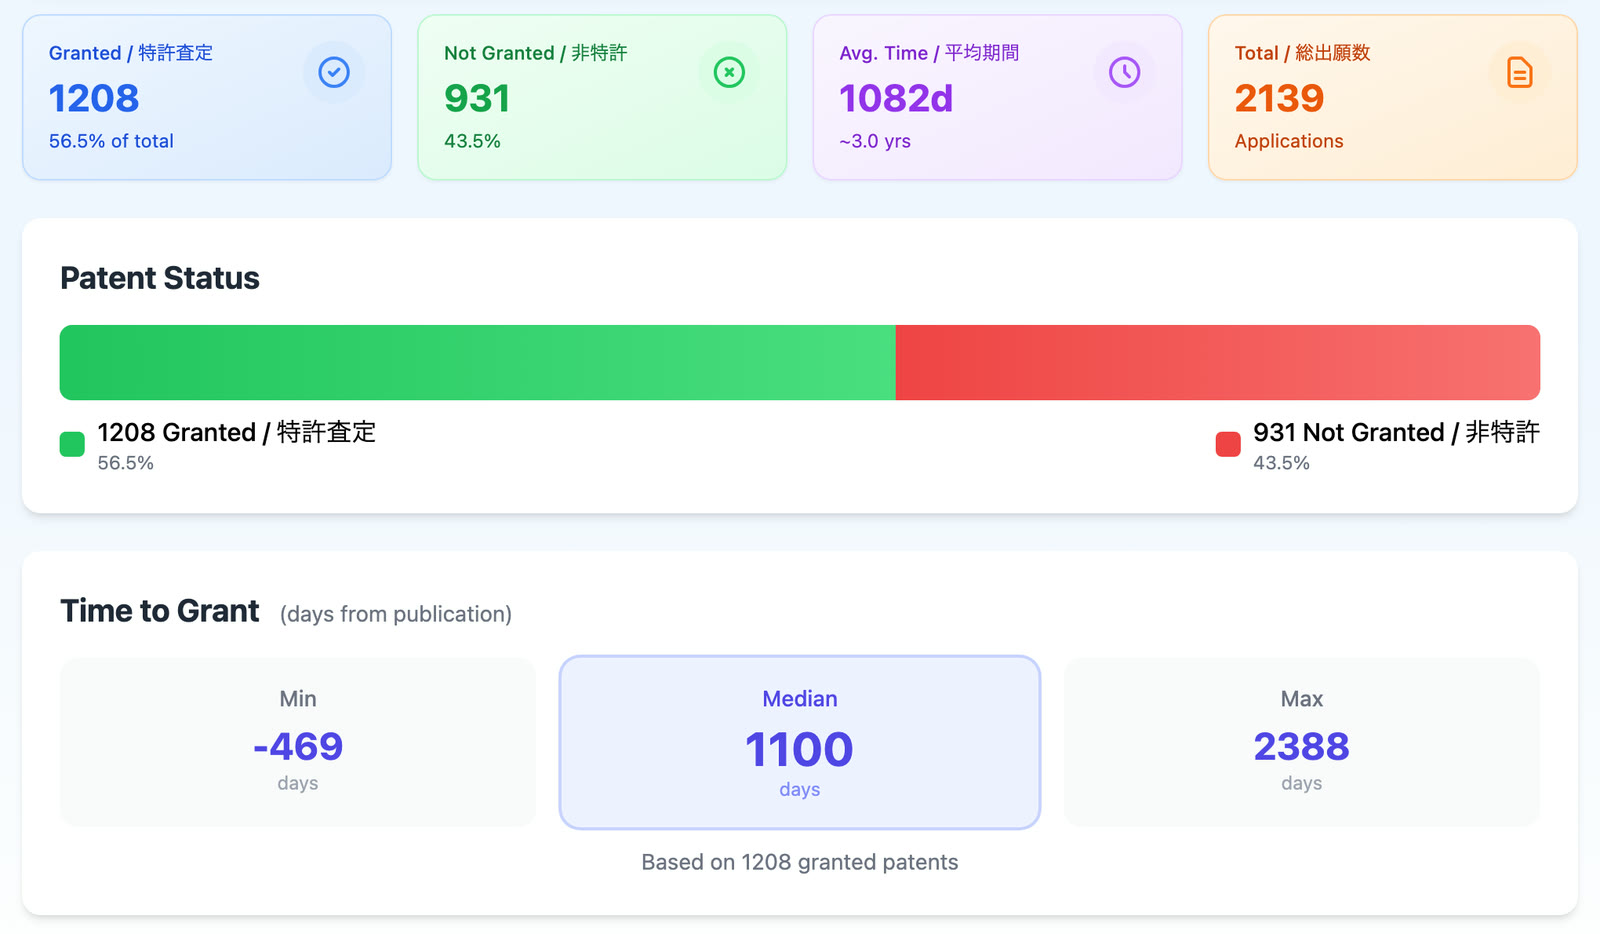
- Time to grant is the number of days from the publication date to the registration date. It is not measured from the filing date. It can be negative when a patent was registered before the application was published.
- Each representative’s page gives the average, median, shortest and longest time to grant over their granted applications.
- An application with three representatives counts once for each of them. The 250,415 “applications” on the front page are these attorney–application pairs, not separate applications.
- The front-page grant rate of 50.1% is granted pairs over all pairs. The average time to grant of 1,020 days is the average of each representative’s own average, without weighting by the number of grants.
A higher rate does not necessarily mean better work. It depends on the clients, the technical fields and how often clients chose not to request examination, and the data covers four months of publications. The site shows a notice saying the rankings should not be the only factor in choosing an attorney.
Browse and search
The front page lists the representatives 100 at a time, sorted by the number of granted applications. Each entry shows the name, the JPO representative code, and the total, granted and not granted counts with the rate. You can search by name, by code, or by applicant, which finds the representatives who handled that company’s applications.
Each representative has a page with the counts, the time-to-grant figures, a table by publication year, a list of their granted applications with links to Google Patents, and the list of applicants they acted for. The site’s labels are in both English and Japanese.
More patent tools
All patent tools →